
Analytics
Analytics in QRCompose provides real-time insights into how your QR codes and pages are performing.
From scan counts and visitor behavior to conversion tracking and geographic distribution - every interaction is measured, visualized, and actionable.
Overview
The purpose of analytics is to help you understand engagement, optimize performance, and measure ROI from your QR campaigns.
Whether you're running a restaurant menu, event registration, or lead generation campaign, analytics give you the data you need to make informed decisions.
Key Benefits
- Real-time tracking – see scans and interactions as they happen.
- Conversion insights – measure form submissions, payments, and reviews.
- Geographic data – understand where your audience is located.
- Device breakdown – optimize for mobile, desktop, or tablet.
- Flow analytics – track multi-step journeys and identify drop-offs.
What Is Tracked
QRCompose automatically tracks a wide range of metrics for every QR code, page, and flow.
Core Metrics
| Metric | Description |
|---|---|
| QR Code Scans | Total number of times a QR code was scanned. |
| Page Views | Number of times a page was loaded (including non-QR traffic). |
| Unique Visitors | Count of distinct users (based on session ID). |
| Session Duration | Average time spent on the page. |
| Bounce Rate | Percentage of visitors who left without interacting. |
| Conversion Rate | Percentage of visitors who completed a target action (form submit, payment, etc.). |
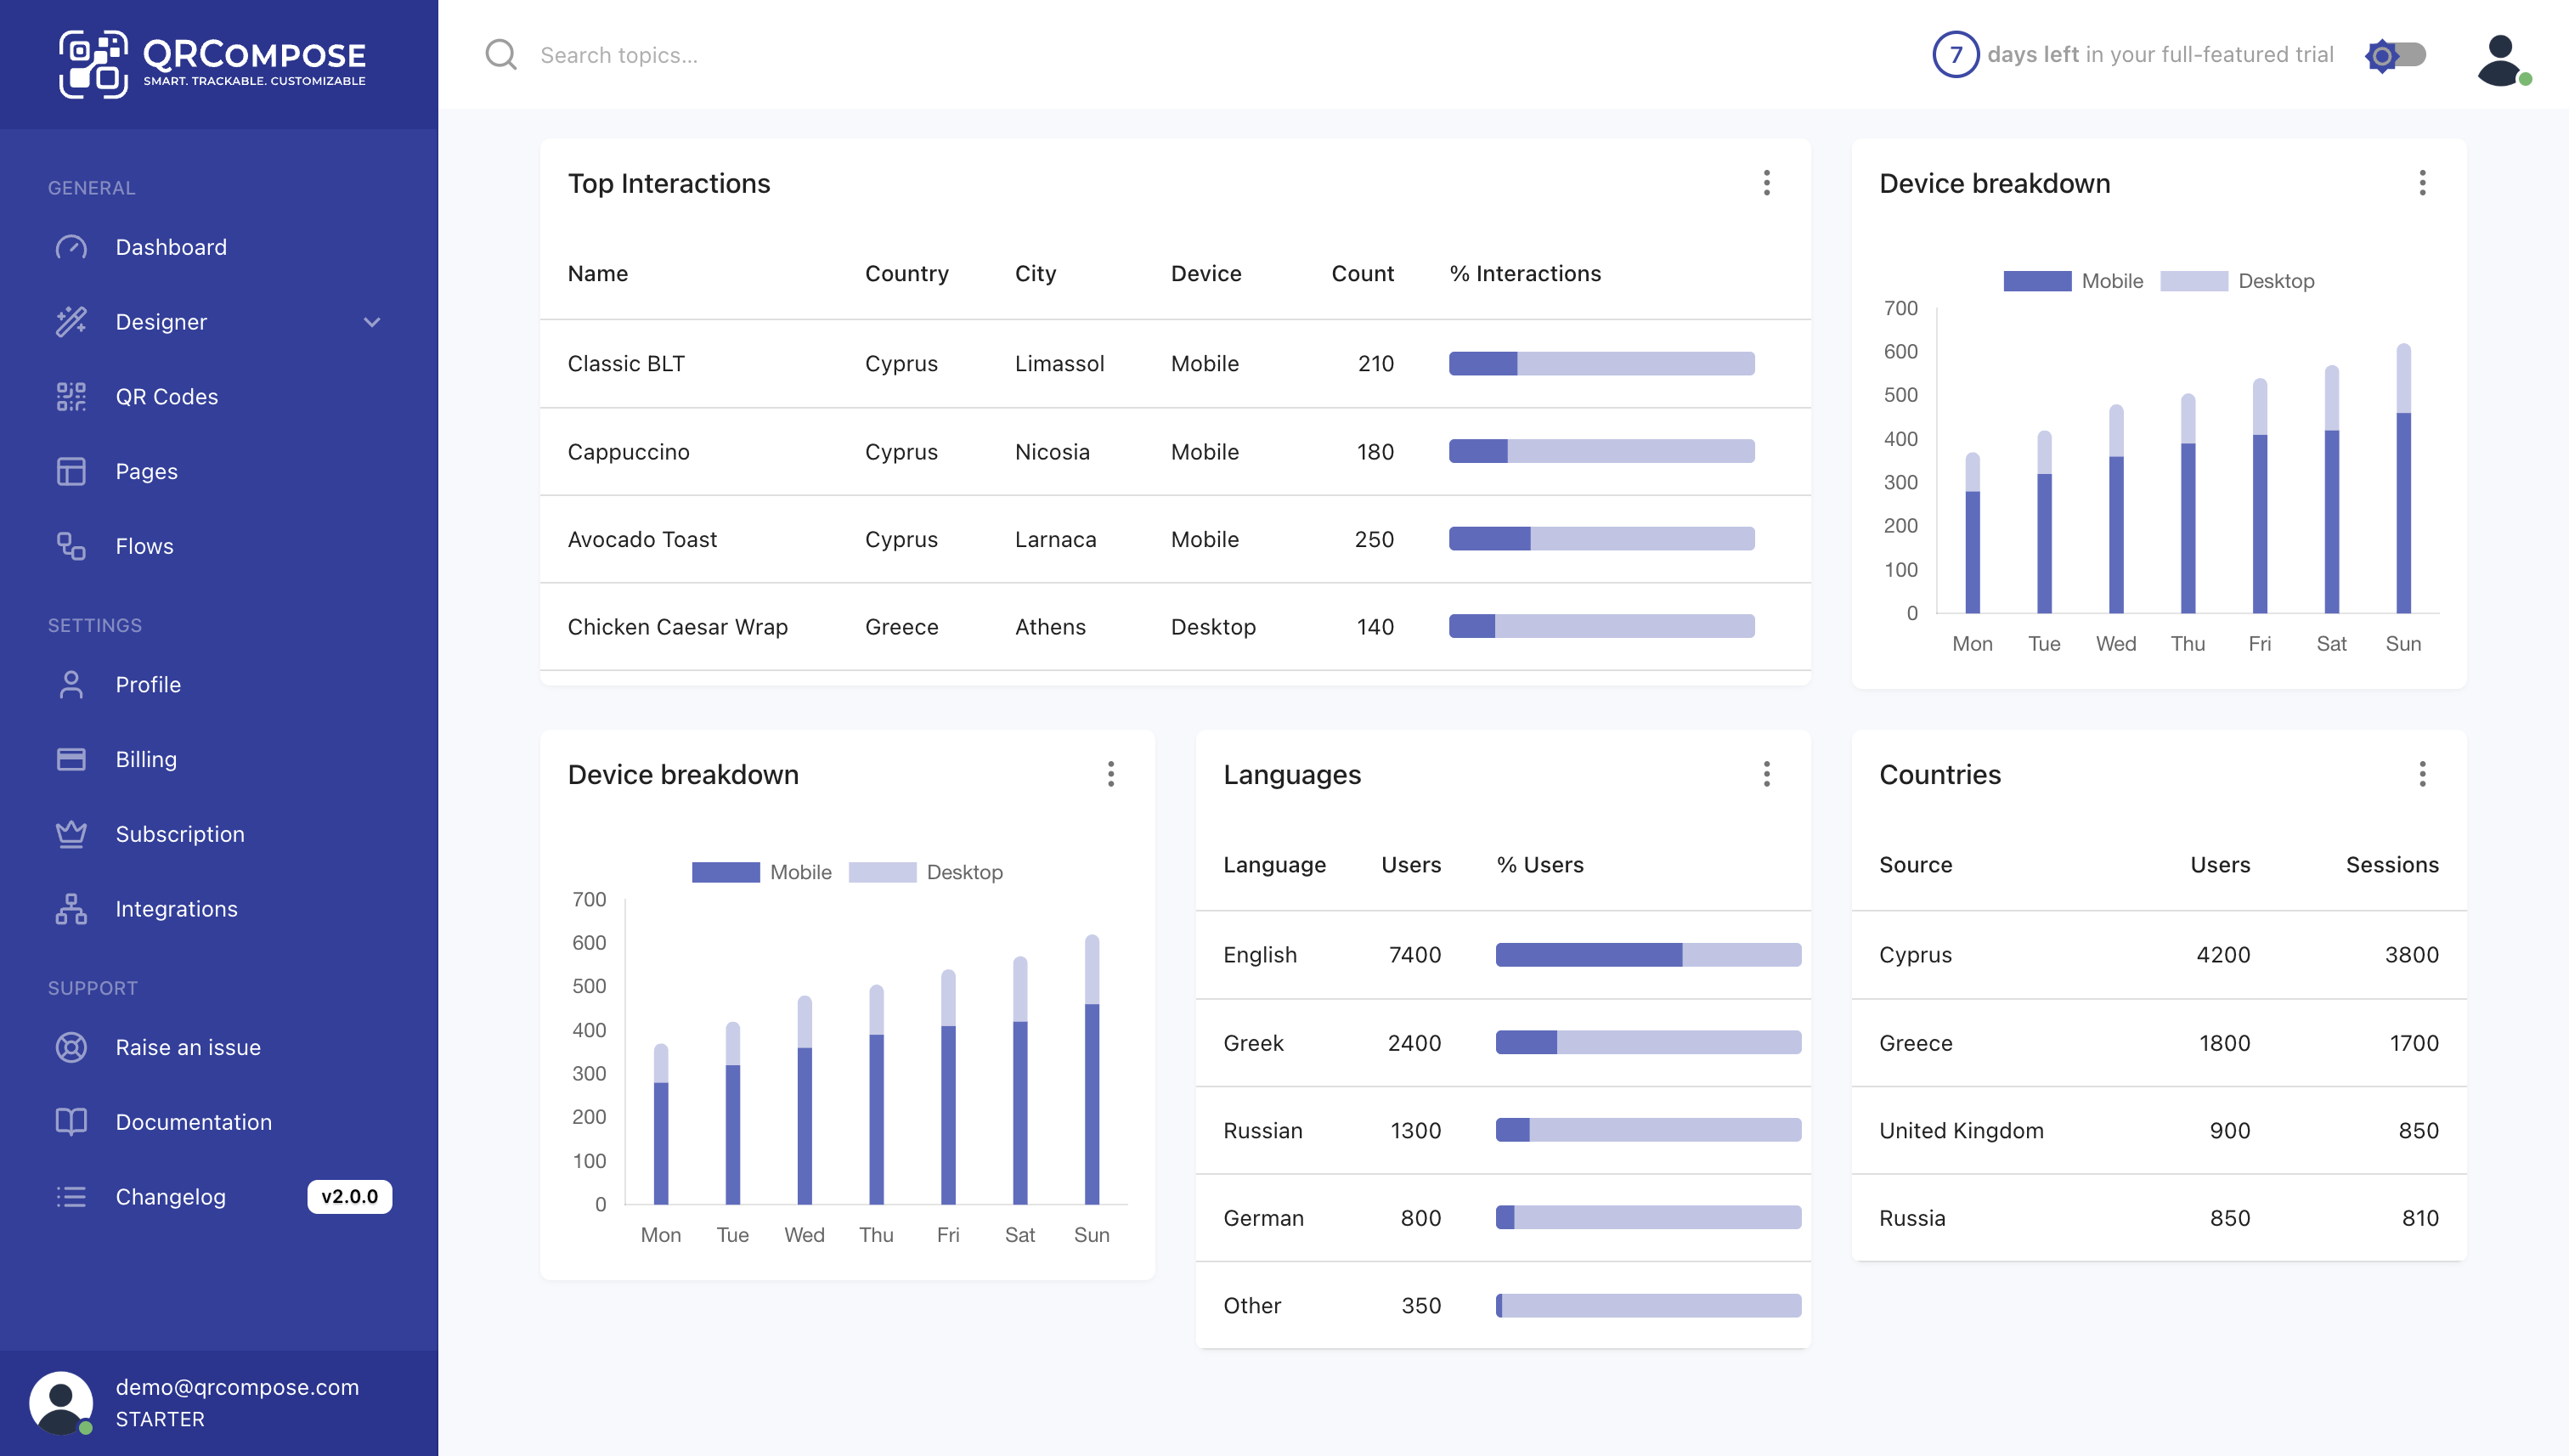
Geographic & Device Data
| Metric | Description |
|---|---|
| Countries | Geographic distribution of scans and views. |
| Cities | City-level breakdown (available for Pro/Enterprise). |
| Device Type | Desktop, mobile, or tablet. |
| Operating System | iOS, Android, Windows, macOS, etc. |
| Browser | Chrome, Safari, Firefox, etc. |
Referral Sources
| Metric | Description |
|---|---|
| Direct (QR Scan) | Traffic originating from a QR code scan. |
| Web Referrer | Visitors who clicked a link from another website. |
| Social Media | Traffic from social platforms. |
| Unknown | Sessions with no identifiable referrer. |
Conversion Events
QRCompose tracks the following conversion events automatically:
| Event | Triggered By |
|---|---|
| Form Submit | Visitor completes and submits a form. |
| Order Placed | Menu order is submitted. |
| Booking Made | Time slot reservation is confirmed. |
| Payment Complete | Payment is successfully processed. |
| Review Given | Visitor submits a review (positive, neutral, or negative). |
| Link Clicked | Visitor clicks a link in Link Tree or external redirect. |
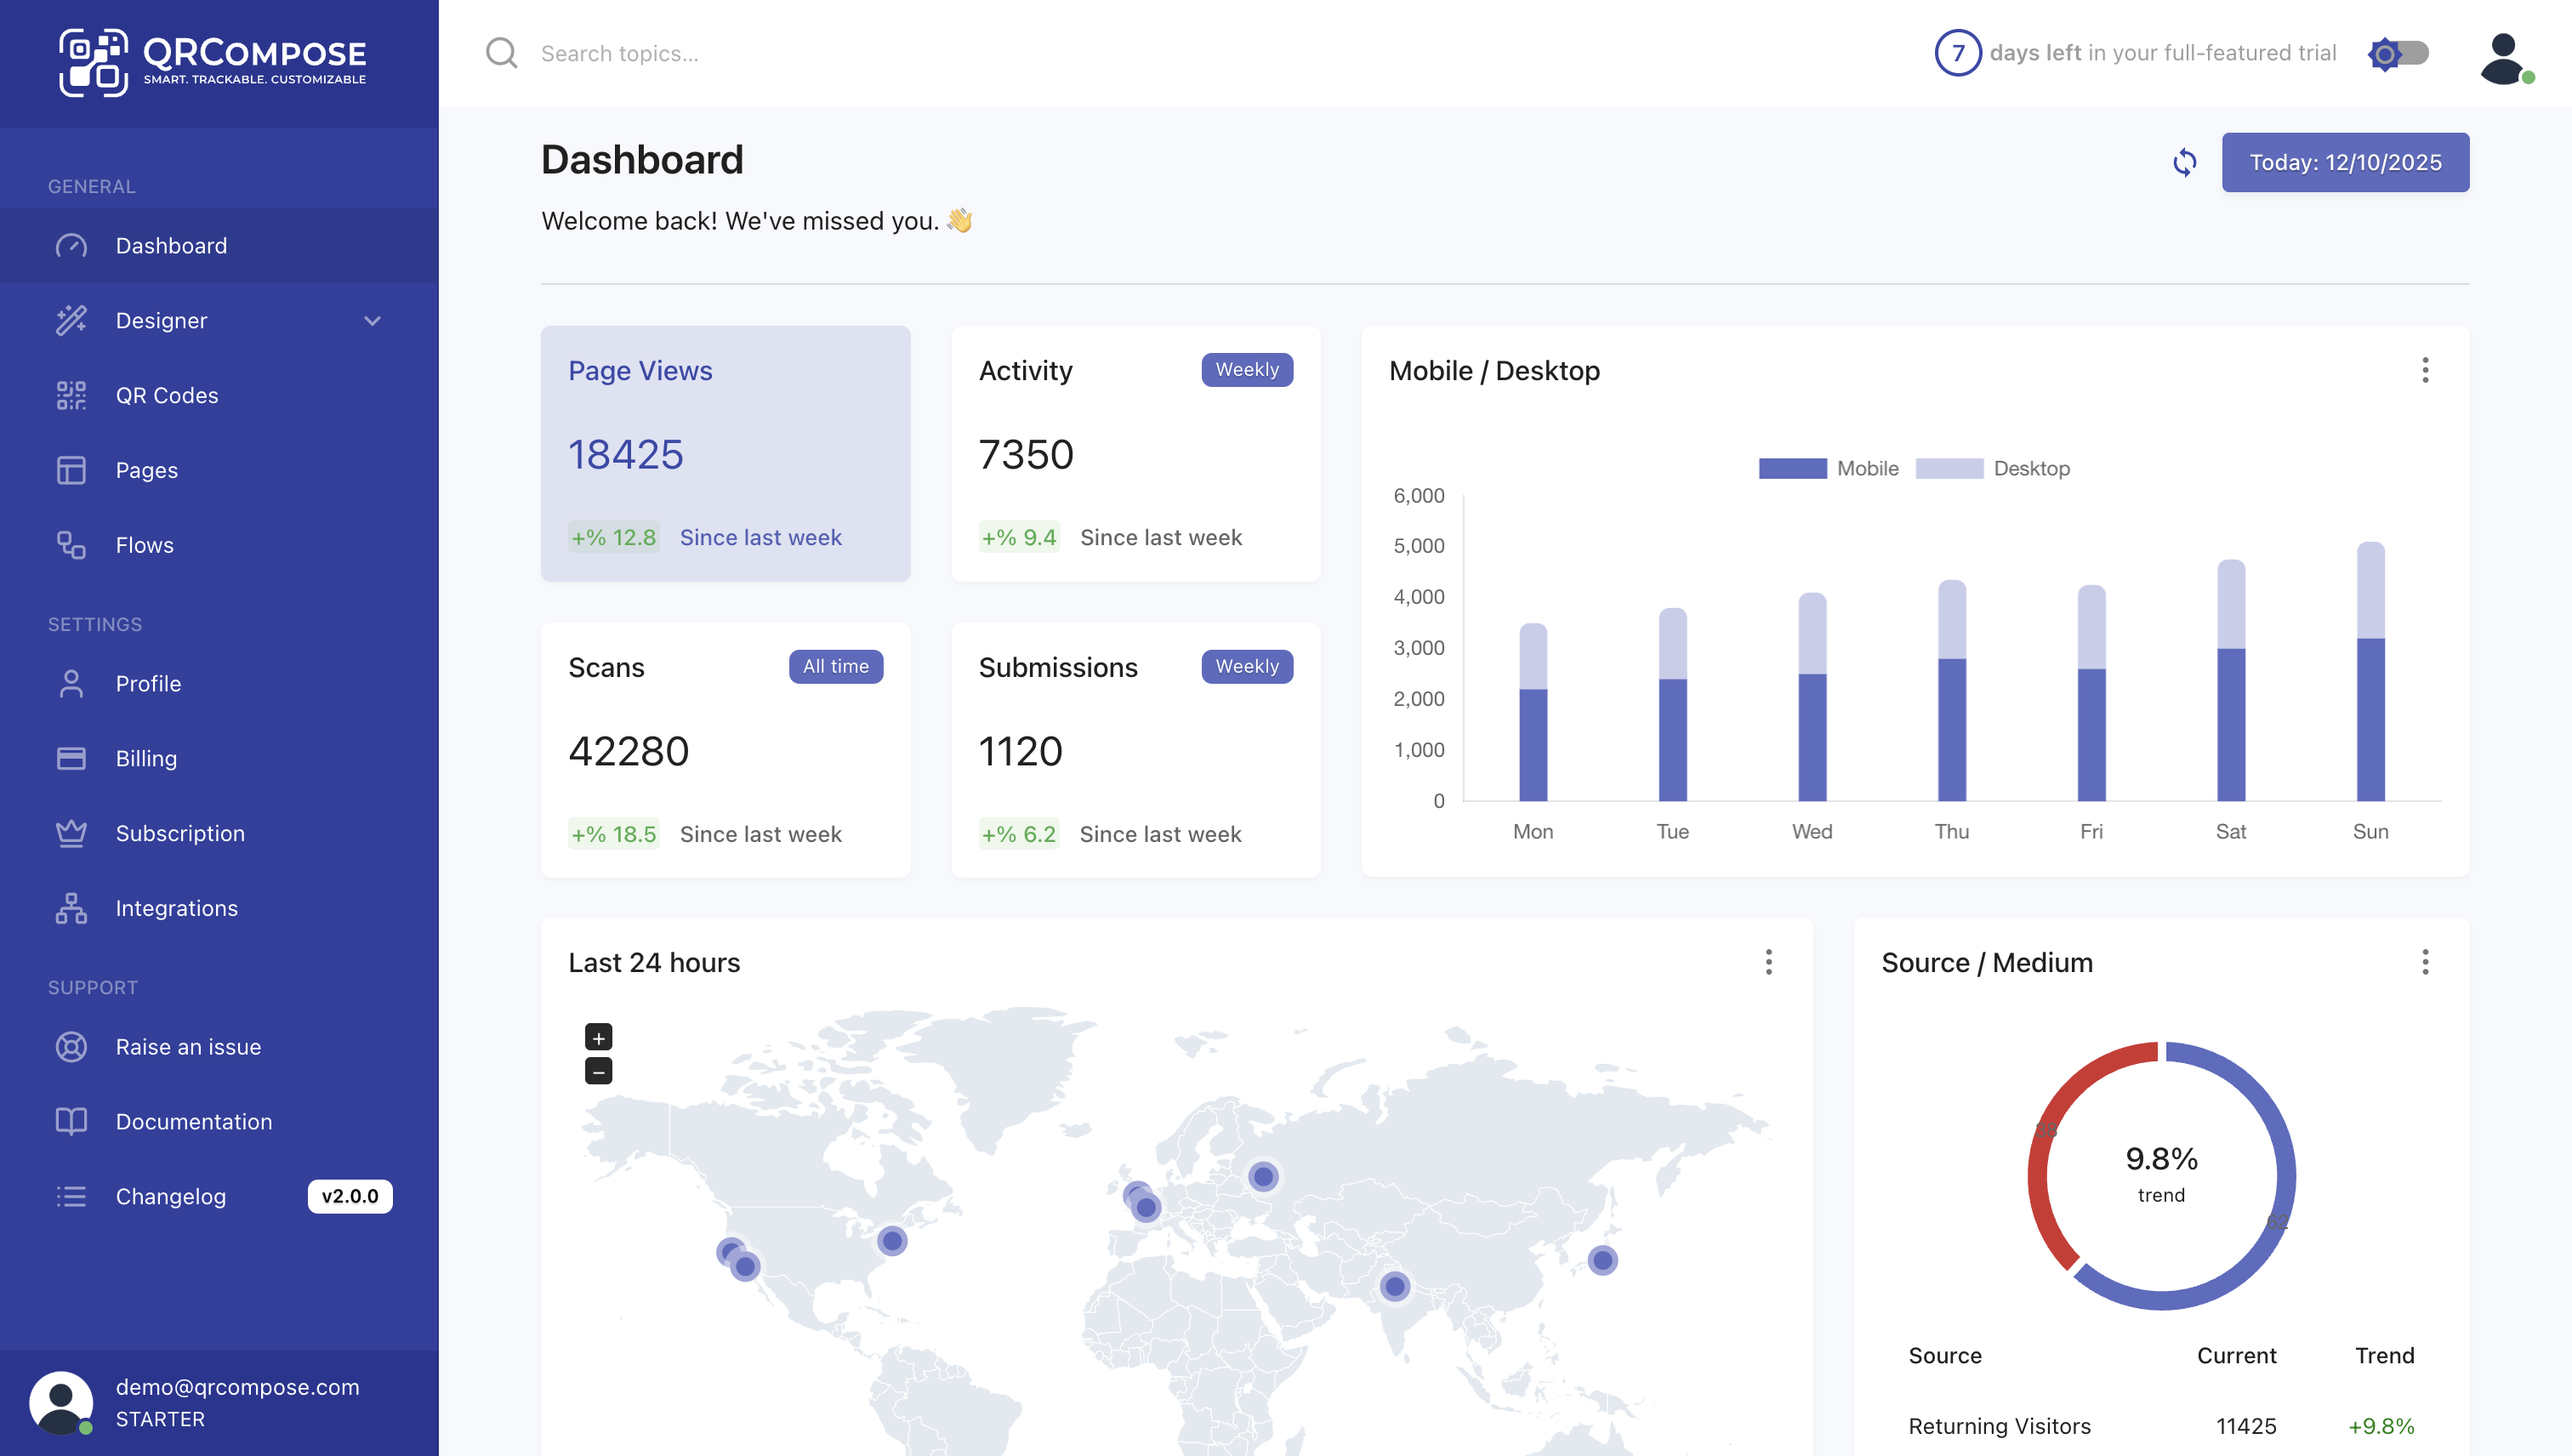
Analytics Dashboard
The Analytics Dashboard is accessible from the main navigation.
It provides visual representations of your data through charts, maps, and tables.
QR Code Analytics
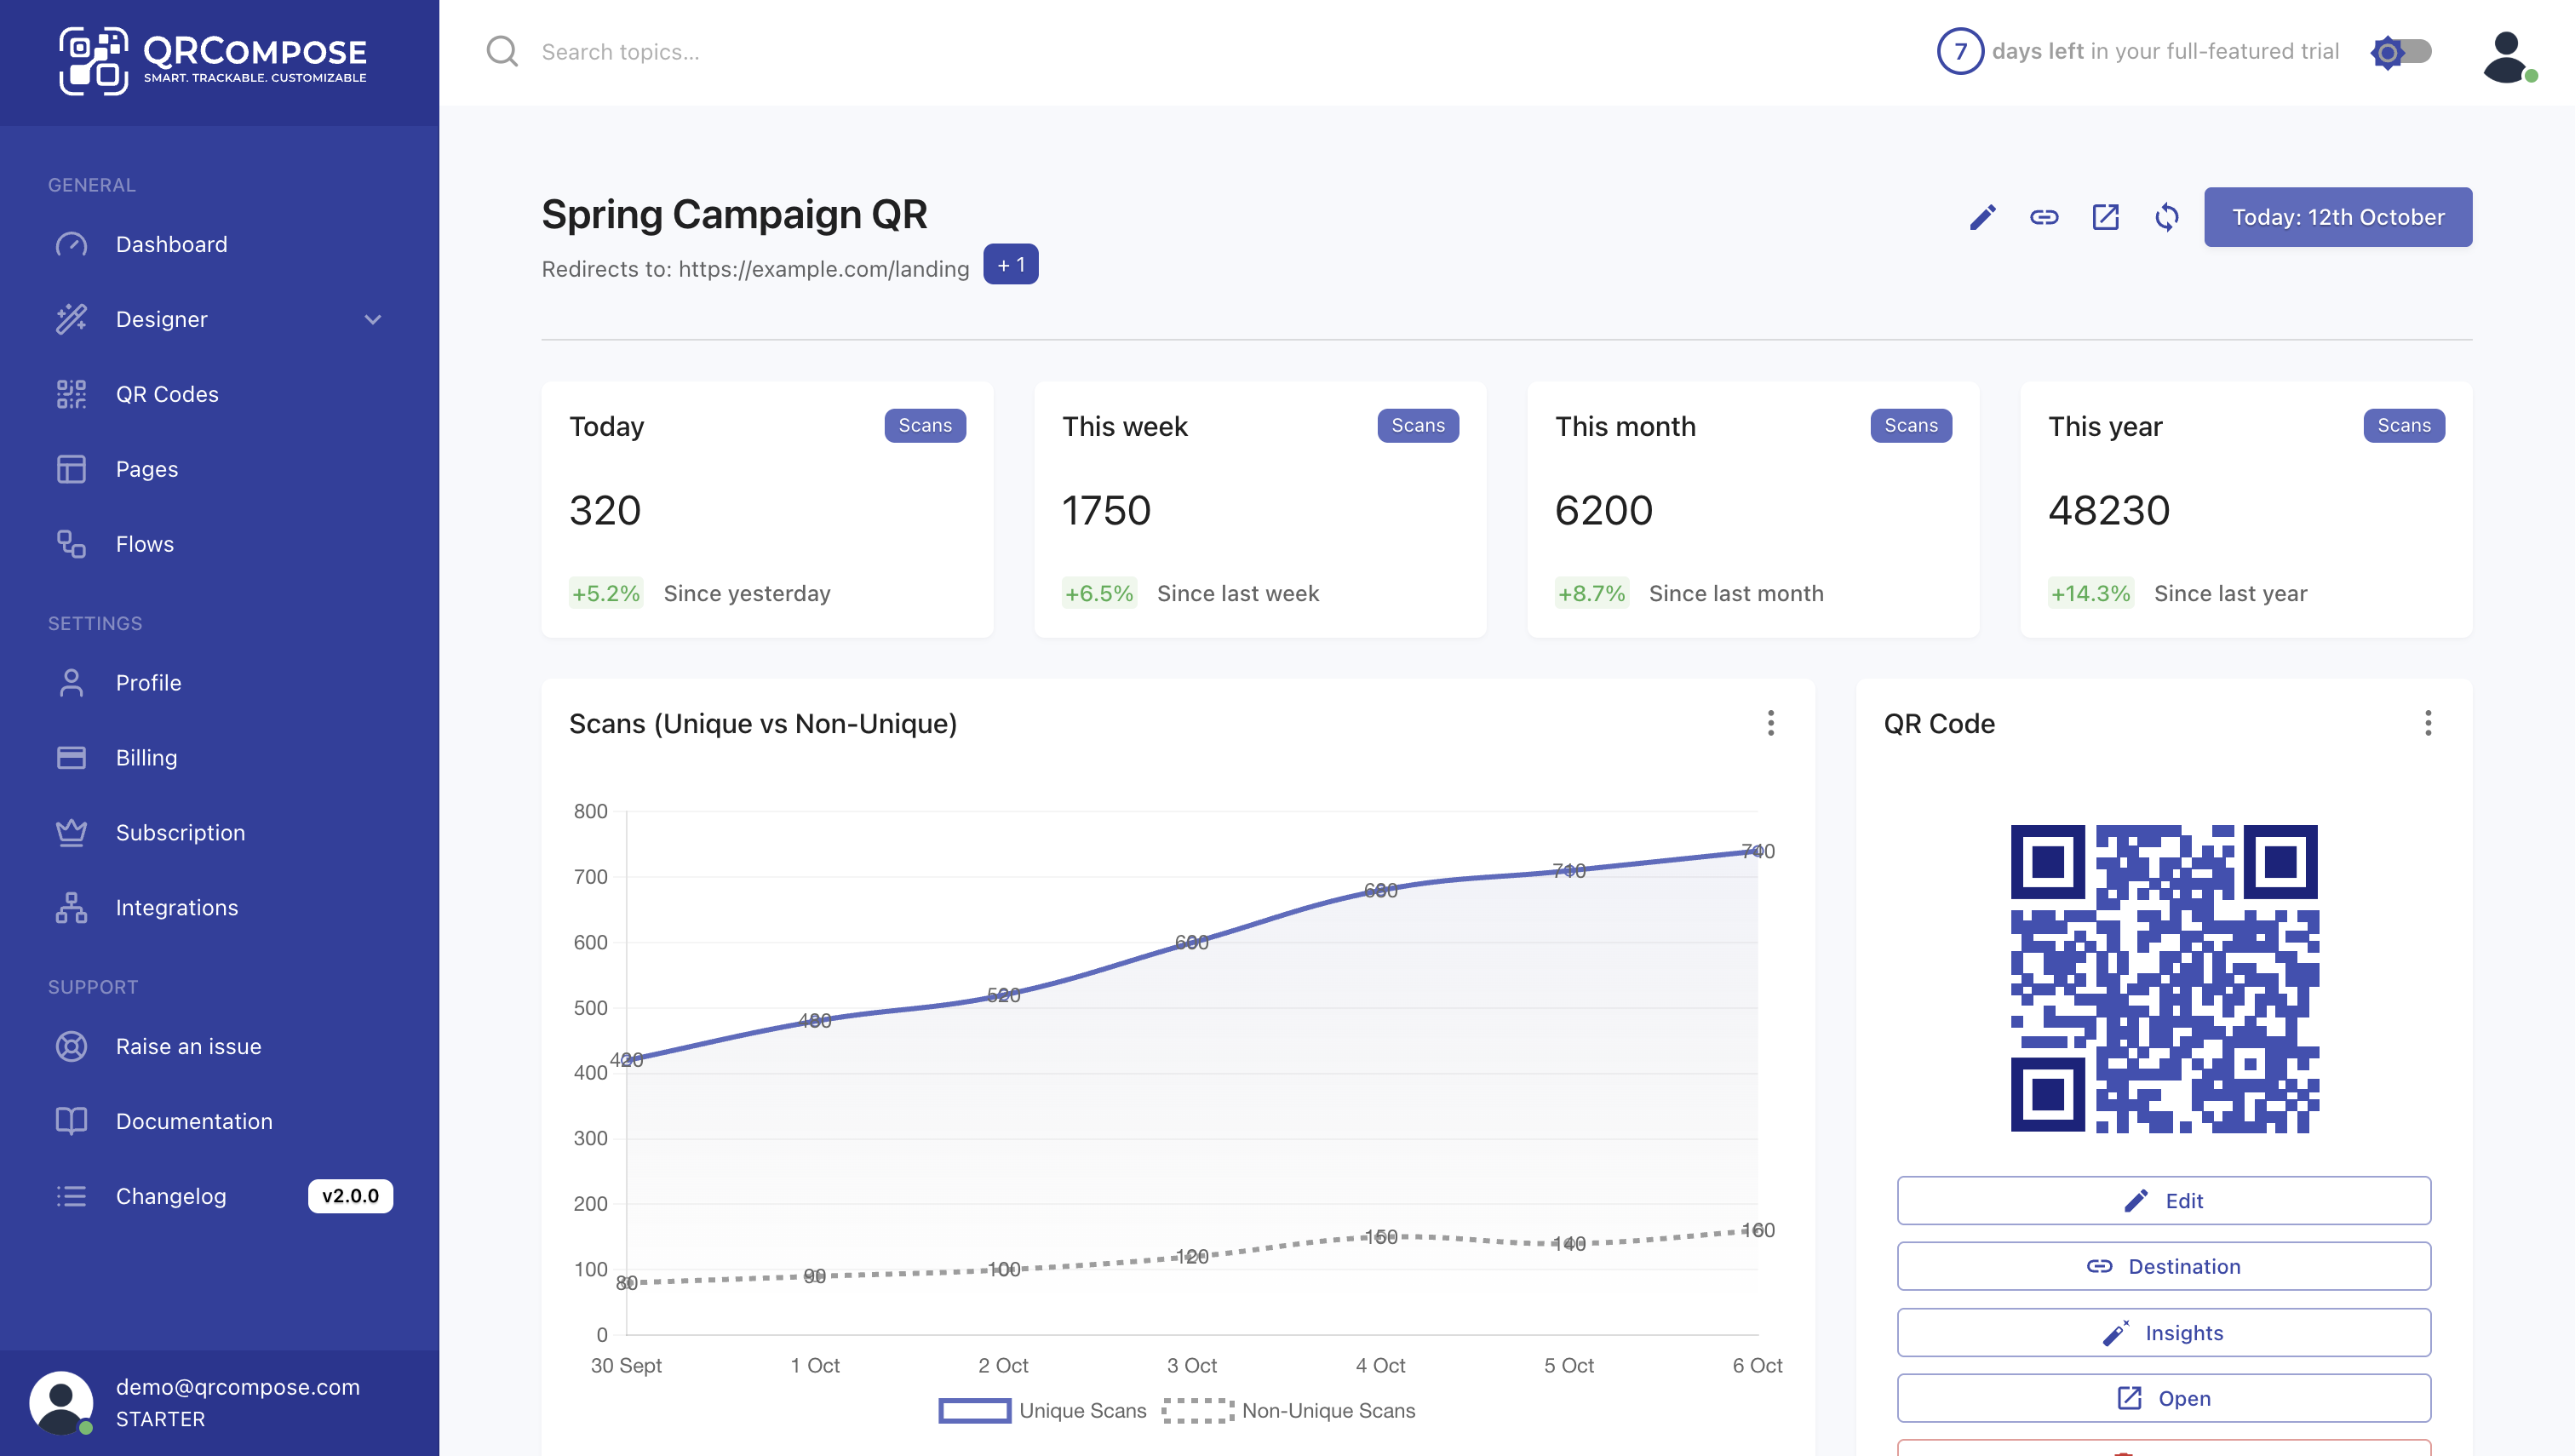
For each QR code, you can view:
- Total Scans – lifetime and date-range filtered.
- Scan Locations – map showing where QR codes were scanned.
- Linked Pages – performance of pages connected to this QR.
- Peak Scan Times – hourly and daily patterns.
Page-Level Analytics
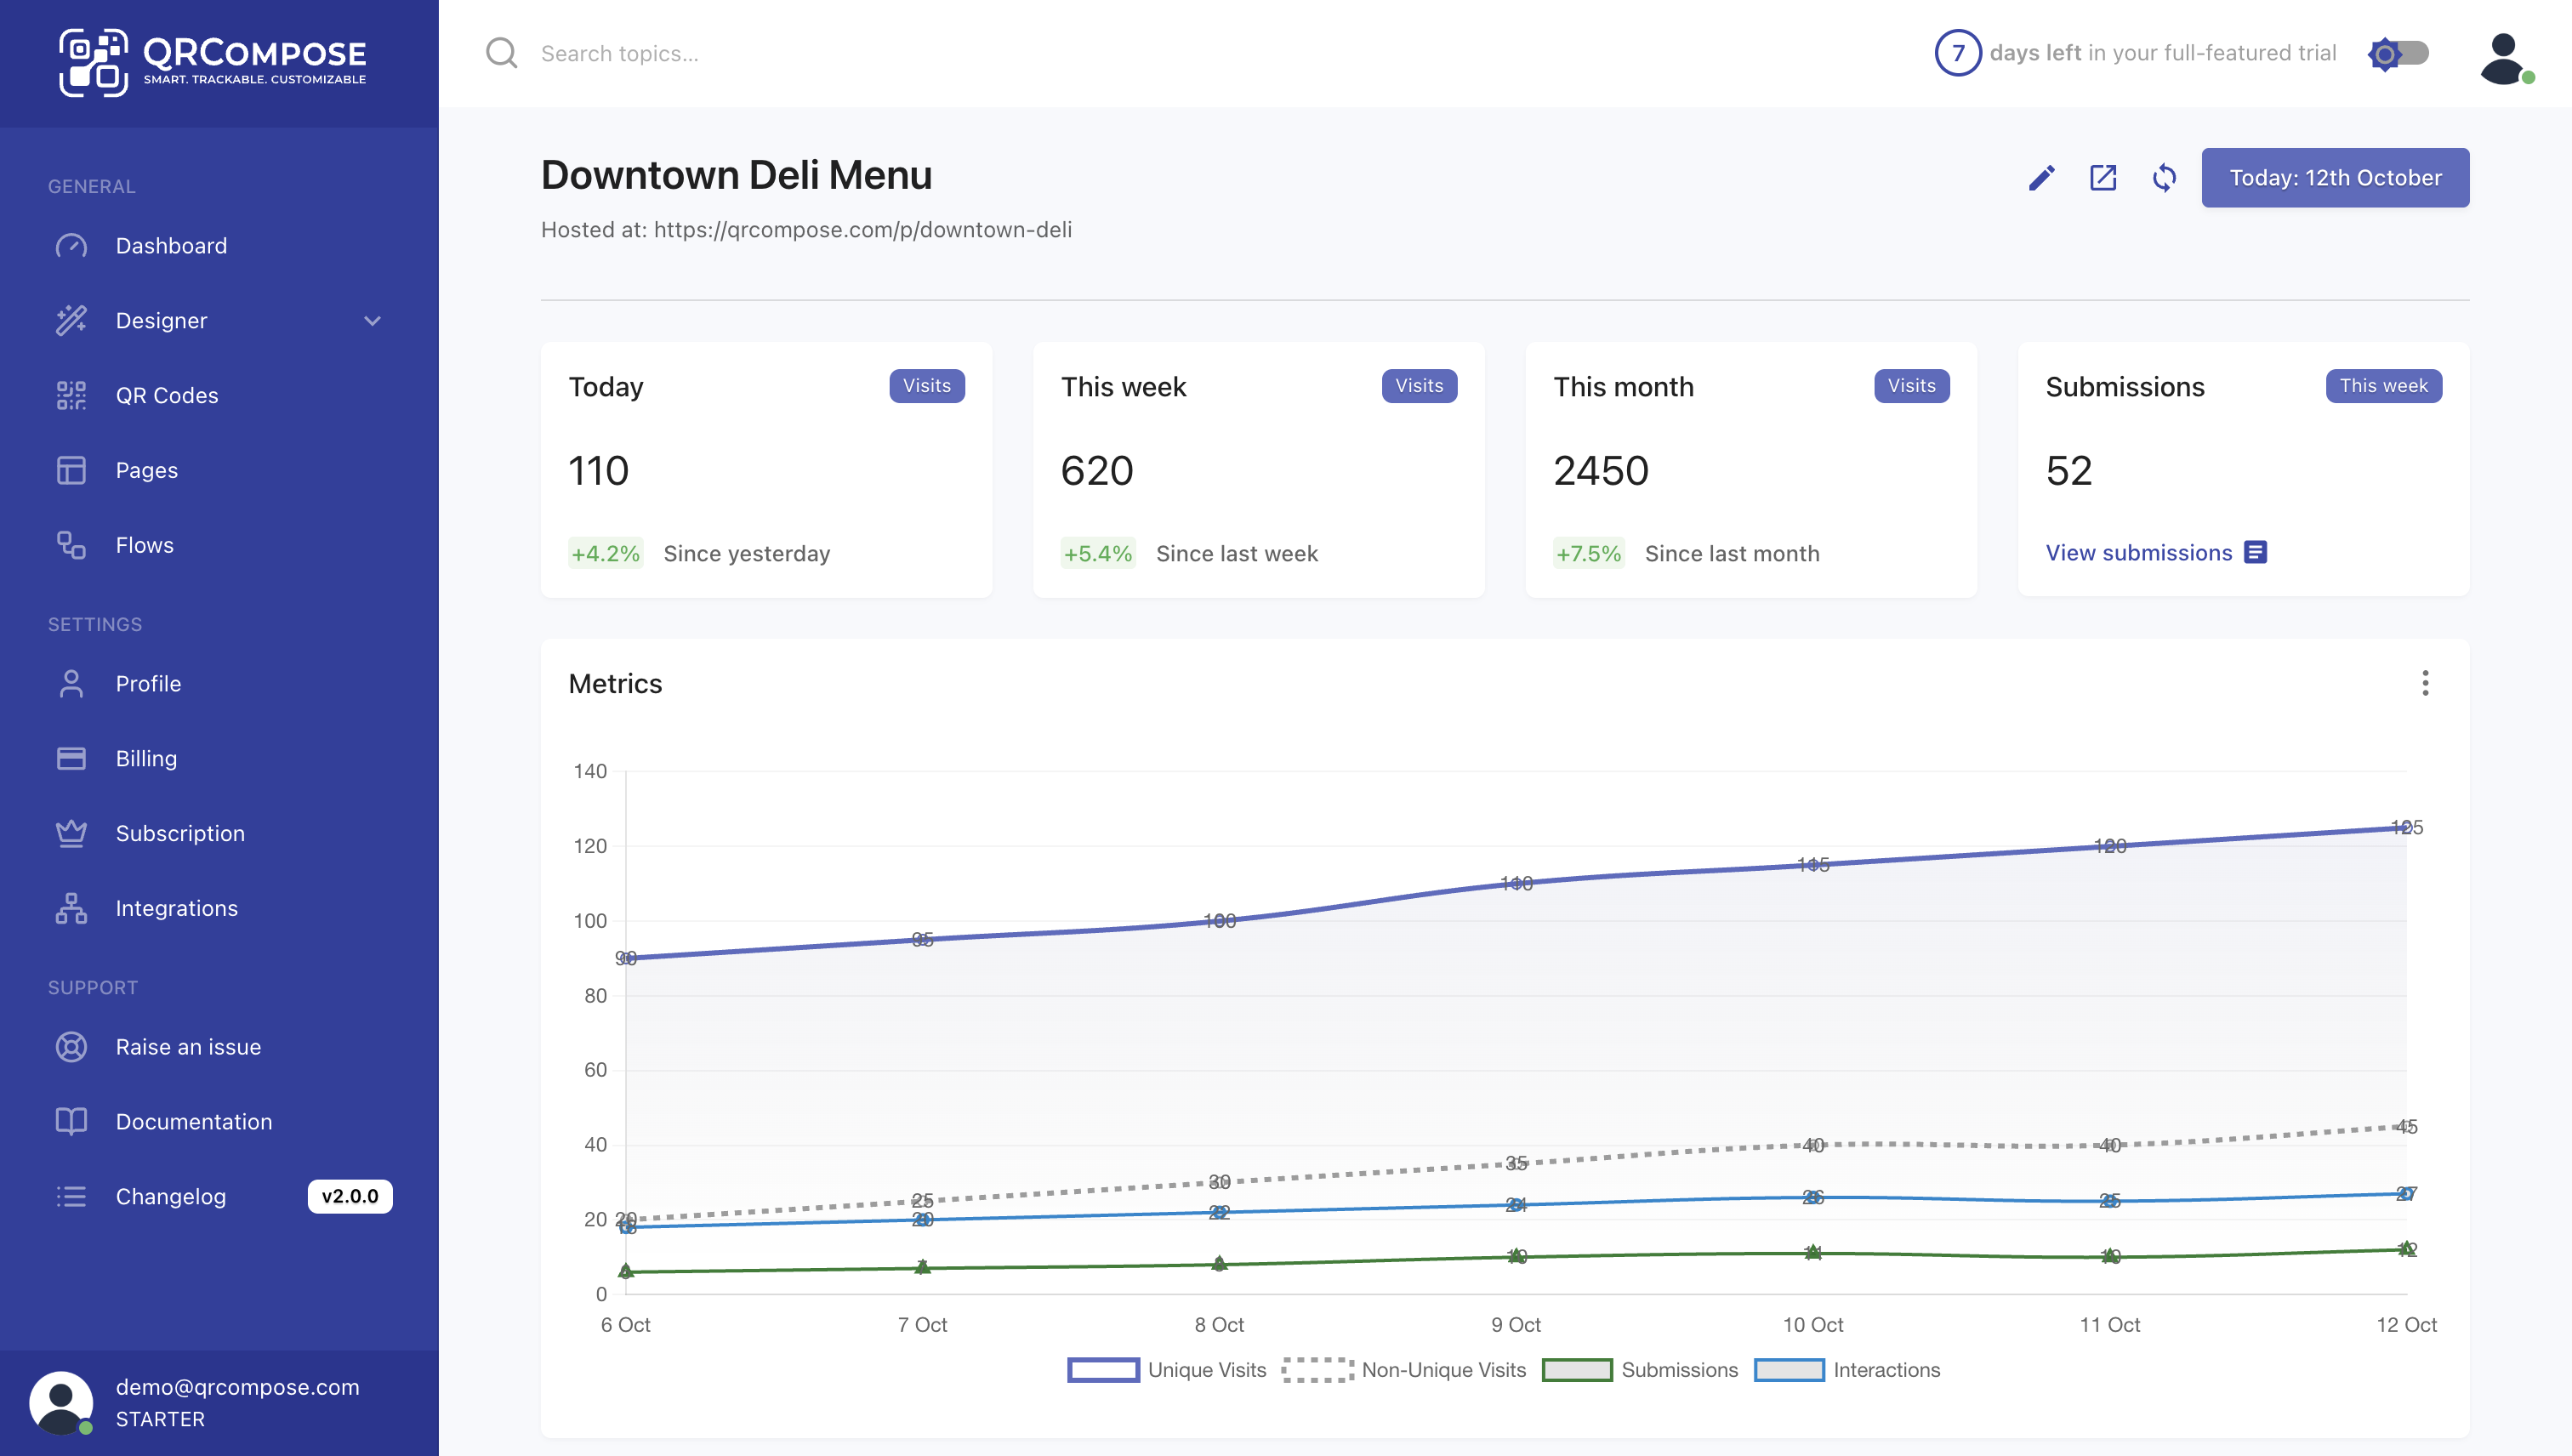
Each page has its own analytics view, displaying:
- Line Chart – page views and unique visitors over time.
- Conversion Funnel – steps from view → interaction → conversion.
- Device Breakdown – pie chart showing desktop vs. mobile vs. tablet.
- Geographic Map – world map with country-level heatmap.
- Top Referrers – list of sources driving traffic.
- Recent Activity – real-time feed of scans and interactions.
Flow Analytics
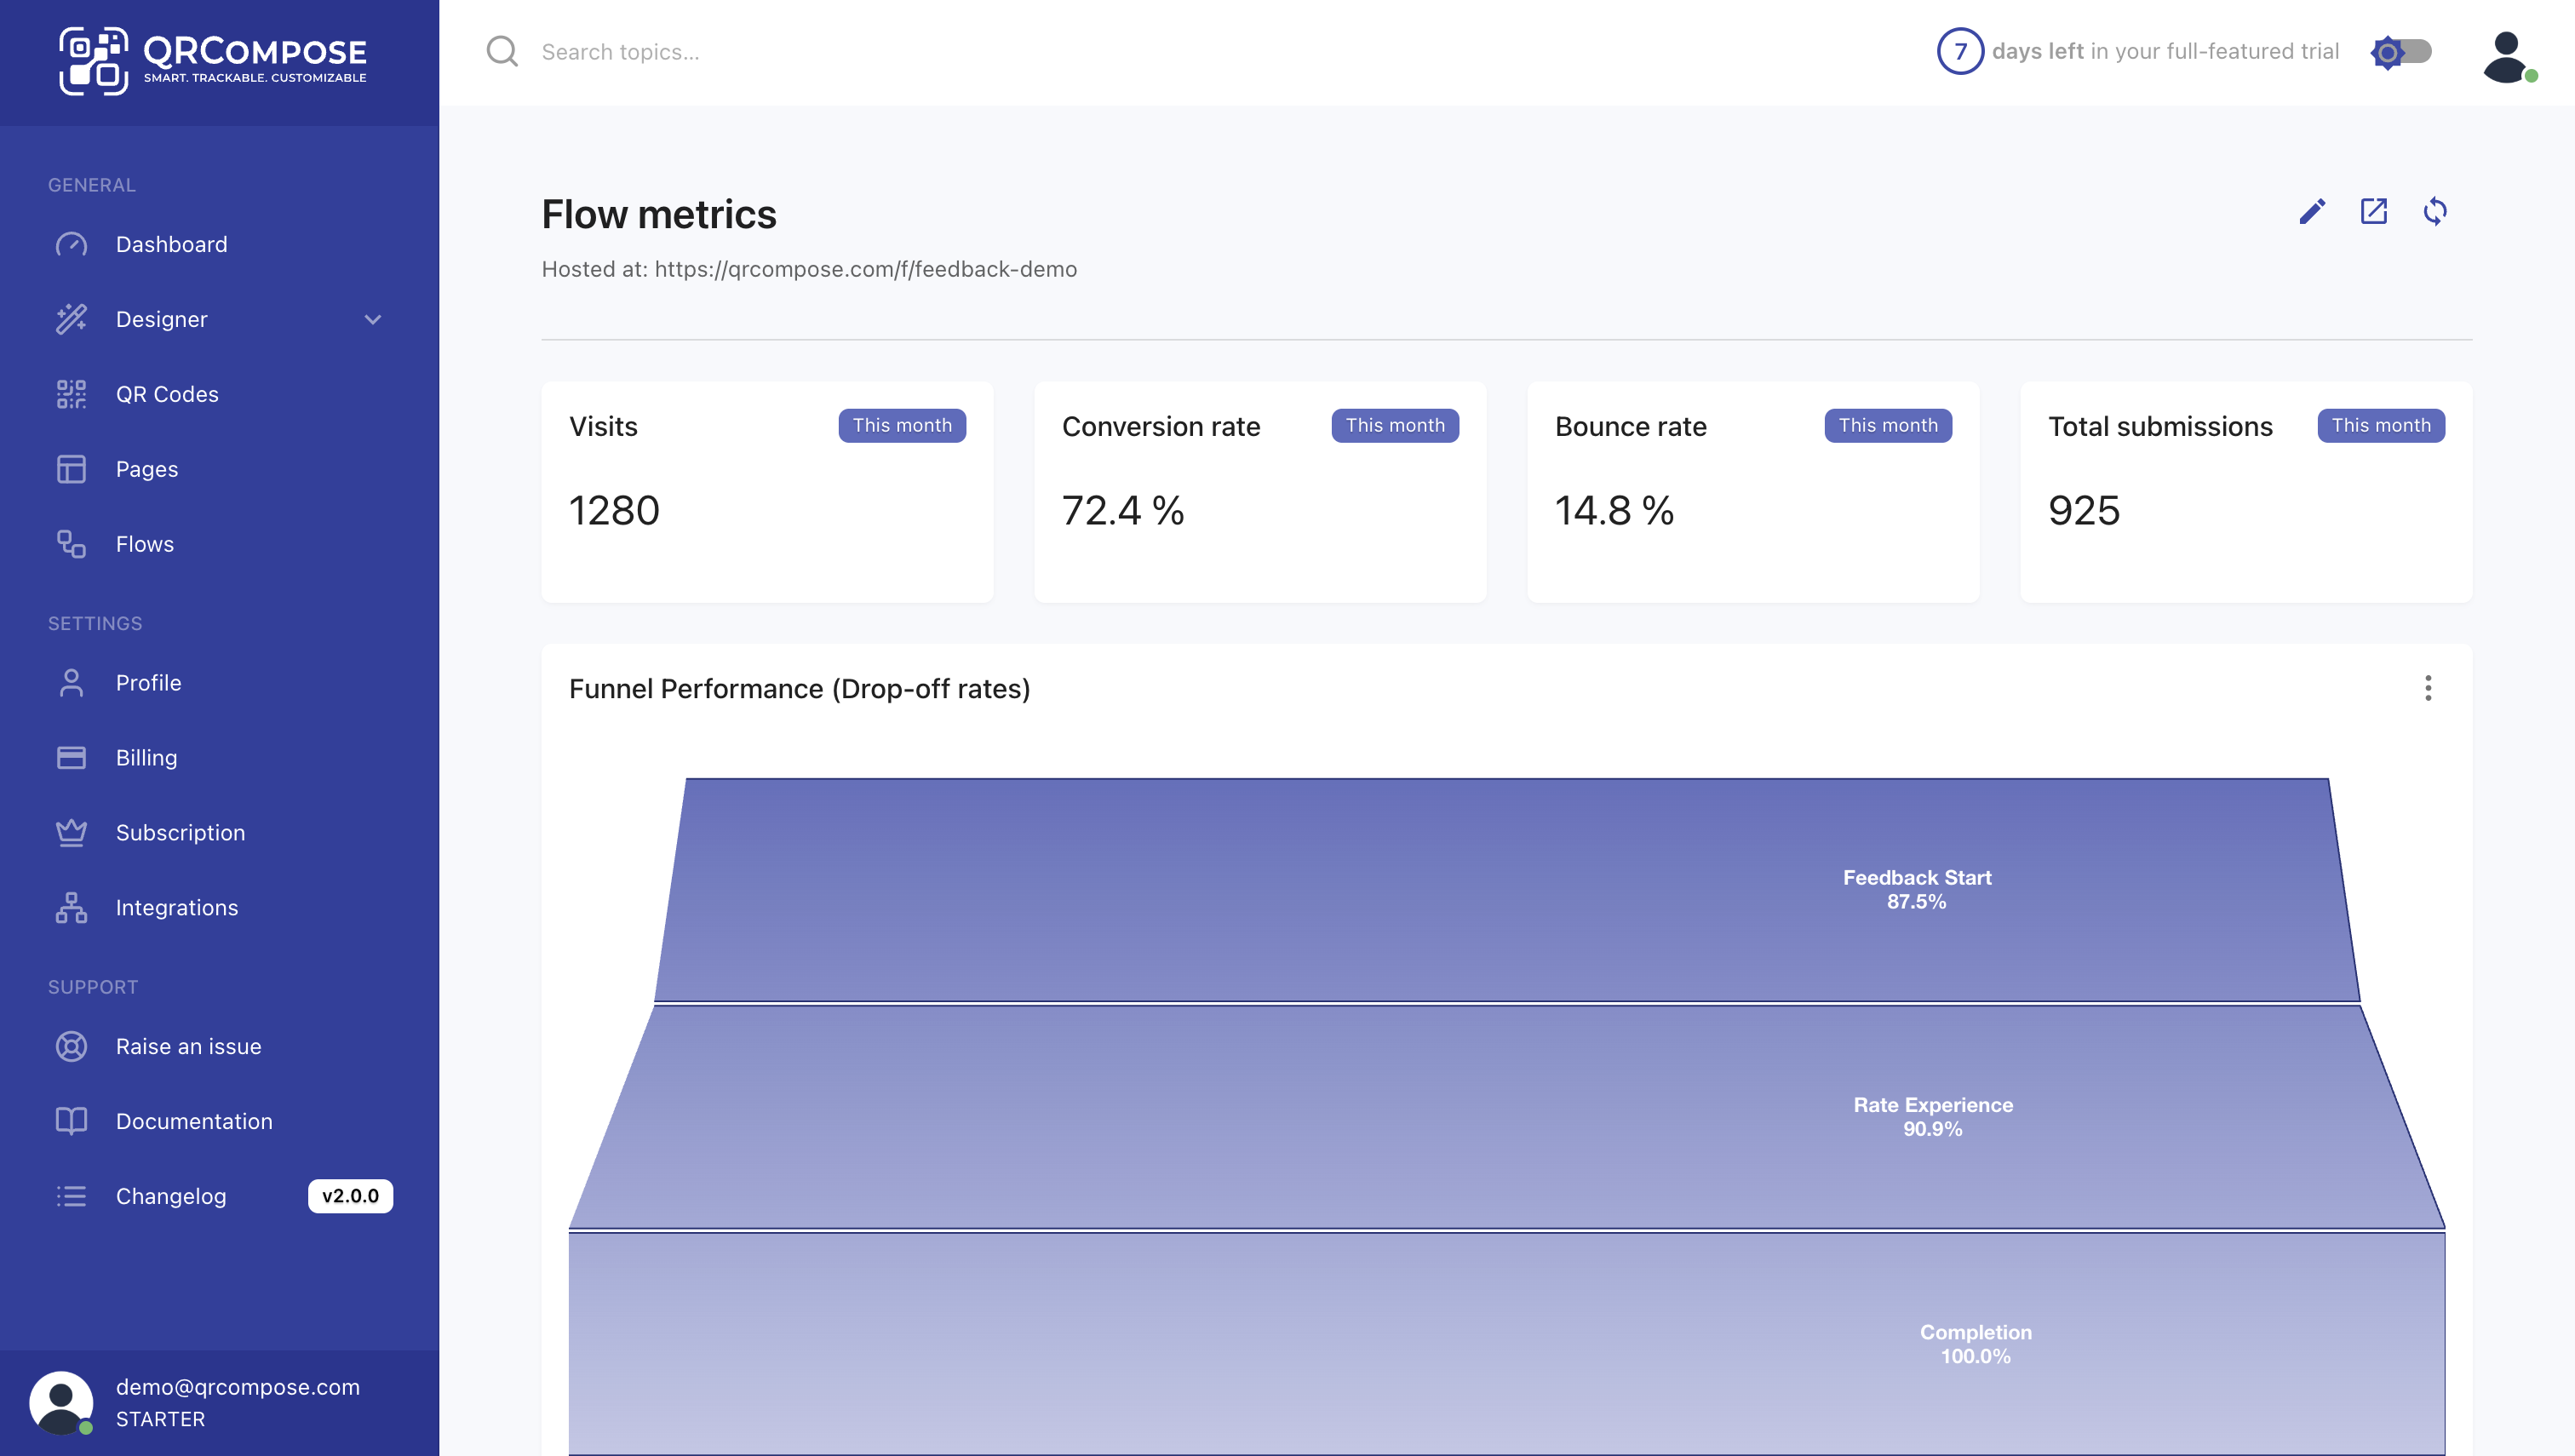
When pages are connected in a Flow, analytics aggregate across all steps.
Flow-Level Metrics
| Metric | Description |
|---|---|
| Flow Starts | Number of users who entered the flow. |
| Step Completions | How many users completed each step. |
| Drop-Off Rate | Percentage of users who exited at each stage. |
| Average Flow Duration | Time from start to completion. |
| Conversion Rate | Percentage of users who completed the entire flow. |
Real-Time Updates
The Analytics Dashboard updates in real-time, meaning you can:
- Watch scans happen live during an event.
- Monitor conversion rates as they change.
- Track geographic spread of a new campaign.
- See which pages are performing best right now.
TIP
Use the Live Feed widget on your dashboard to monitor activity as it happens - perfect for events, launches, or time-sensitive campaigns.
Best Practices
Track Conversions from Campaigns
Set up unique QR codes for different campaigns (e.g., Table QRs, Flyer QRs, Social Media QRs) and compare their performance.
Compare Different QR Placements
Place identical QR codes in different locations (entrance, table, counter) and use analytics to see which placement drives the most engagement.
Use A/B Testing with Conditional Redirects
Create two versions of a page and use Conditional Redirects to split traffic 50/50, then compare conversion rates.
Monitor Drop-Offs in Flows
If you see users exiting at a specific step in a flow, consider:
- Simplifying the form
- Reducing required fields
- Improving page load speed
- Adding trust signals (logos, security badges)
Summary
Analytics in QRCompose turn every QR code into a measurable marketing channel.
With real-time tracking, detailed conversion insights, and powerful filtering, you can optimize campaigns, understand your audience, and prove ROI - all from a single, intuitive dashboard.